Purpose of Study:
This research measured changes in the reading proficiency of middle school students (sixth, seventh, and eighth grade) following a six-month course of web-based silent reading practice using the Reading Plus program.
Study Design:
Students attending one of two middle schools in the southeast U.S. were evaluated in both the fall and spring of the 2013-2014 school year using the nationally normed Group Reading Assessment Diagnostic Evaluation (GRADE™). During the 24 weeks between these two assessments, students were scheduled to complete four reading practice lessons per week.
Key Results:
Pre- and post-treatment GRADE scores were obtained from 437 students who completed reading practice lessons. Most of these students scored below the national average on the GRADE, with only 11% scoring above the 50th percentile. The actual amount of reading practice completed ranged from 1-20 lessons (n = 33) to more than 100 lessons (n = 117).
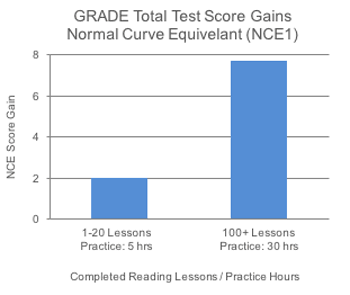
Pre- post-differences in GRADE Total Test scores differed significantly in relation to the amount of reading practice a student completed. Overall, increased program use was associated with larger Total Test score gains; students who completed 20 or fewer lessons over the school year increased their GRADE Total Test standard scores (TTSS) by 1.42 points (or 2.0 NCE1 points), while those who completed 100 or more lessons increased their TTSS by an average of 5.44 points (or 7.8 NCE points) (TTSS: p < .01, effect size = 0.34; NCE p < .05).
In broad terms, this study found that students who completed at least 100 reading practice lessons (~30 hours) were able to achieve reading proficiency gains on a nationally-normed third-party measure of reading proficiency that were nearly four times as large as those measured in students who completed 20 or fewer lessons (~5 hours).
1 Normal Curve Equivalents are commonly referred to as NCEs. Many state and federal agencies use them as a reporting method for specialized programs such as Title 1. NCEs are based on percentiles but have been statistically converted to an equal-interval scale of measurement. Therefore, NCEs can be arithmetically manipulated, meaning they can be averaged. This makes them particularly helpful for reporting data. The range of NCEs is from 1 (corresponding to a percentile rank of 1.0) to a score of 99 (or 99th percentile rank) with a mean of 50.

